- Office Directory
- Hotline Numbers
LAND USE TRENDS
Accessibility
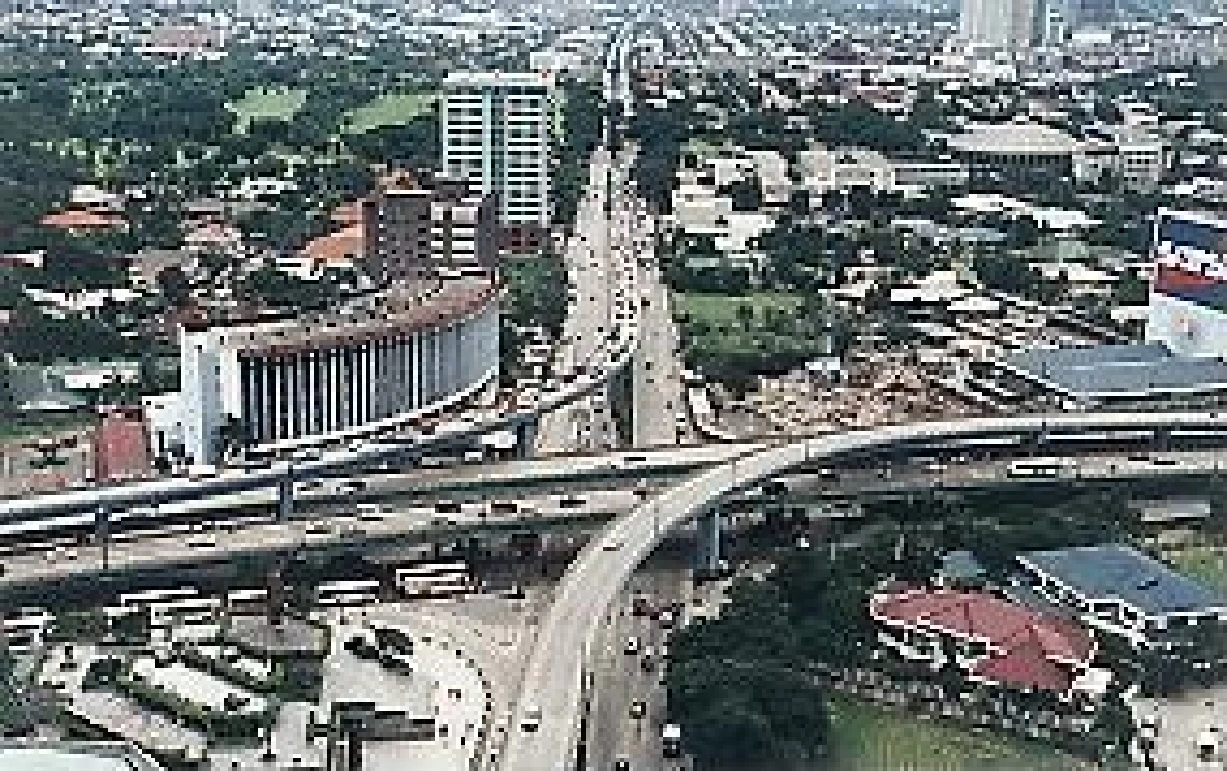
EDSA-Ortigas Avenue InterchangeAs emphasized in the previous sections, accessibility is among the city’s prime advantages. The city is provided with good access roads to and from adjacent cities and municipalities.
Considered as the heart of Metropolitan Manila, main roads such as Epifanio de los Santos Avenue (EDSA), Ortigas Avenue and Shaw Boulevard provide inter-city linkages, while Boni Avenue and Martinez Street (C-3 Road) serve as alternate routes.
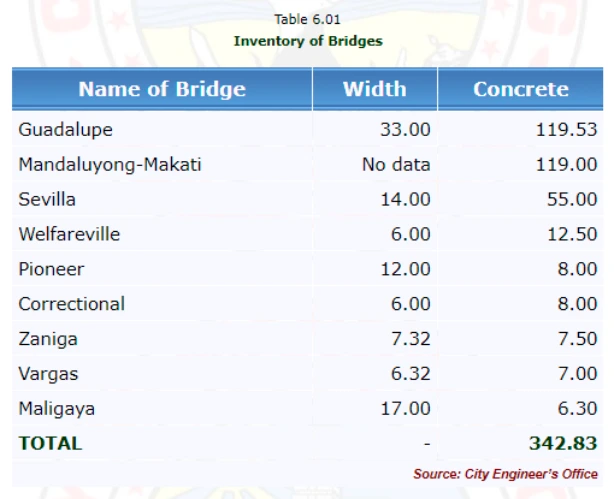
A total of nine (9) concrete bridges (Table 6.01) connect gaps in the road network while several minor roads provide additional access from the San Juan Municipality.
All in all, the city has 31 entry and exit points, as can be seen in Map 56. Also shown are network interchanges designed to facilitate crossing and access to EDSA, as well as existing and proposed rail transport lines traversing the city.
Road Pattern and Density
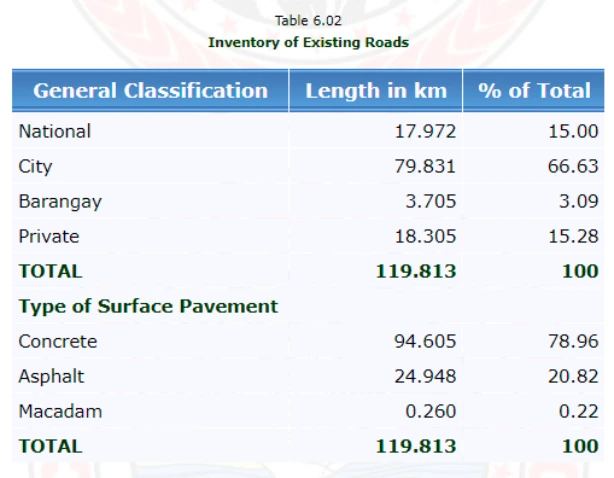
At present, the city is served with a total of 119.813 km of roads (see Table 6.02) classified into four (4) types of administration: national, city, barangay and private roads. This gives a road density of 10.60 km for every 100 hectares of land, way above the standard ratio of 1 km/100 ha., making Mandaluyong actually over-served with roads. This, however, does not ensure efficiency of the road network, which is also affected by socio-economic factors, land use characteristics, and the environmental condition of the area it serves.
Traffic Management
The city has two offices that ensure the management of the city’s traffic flow:
the Traffic and Parking Management Office (TPMO); and
the PNP Traffic Enforcement Division of the City Police.
The TPMO employs traffic aides who direct traffic on congested streets and intersections. Towing and impounding of stalled vehicles are also carried out by the division to ensure that streets and thoroughfares are free from any obstruction that may result to congestion and bottlenecks.
The PNP Traffic on the other hand takes care of major thoroughfares, responds to traffic emergencies and issues violation tickets to traffic violators.
Modes of Transport
Land Transportation
Being an inland city and generally flat but for a few gentle slopes, internal circulation is land-based utilizing different modes of transportation such as public utility jeepneys, tricycles and pedicabs, private cars and the rail transit system.
Of these, the most popular is the jeepney, considering the income class of majority of the commuters and its economic advantage over the car in relatively short distances within and outside the city’s periphery.
While jeepneys ply the main city roads, tricycles and pedicabs serve the interior roads both through zone routes and upon demand of passengers.
Commuters traveling the length of EDSA commonly use the Metro Rail Transit (MRT) as it considerably reduces travel time about ten-fold compared to the regular commuter bus. The MRT has three stations in the city: at Boni Avenue, Shaw Boulevard and Ortigas Center.
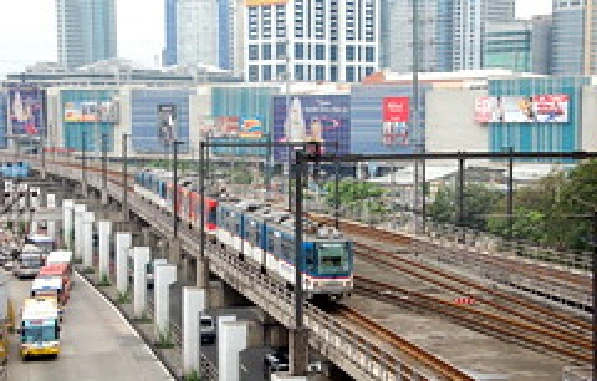
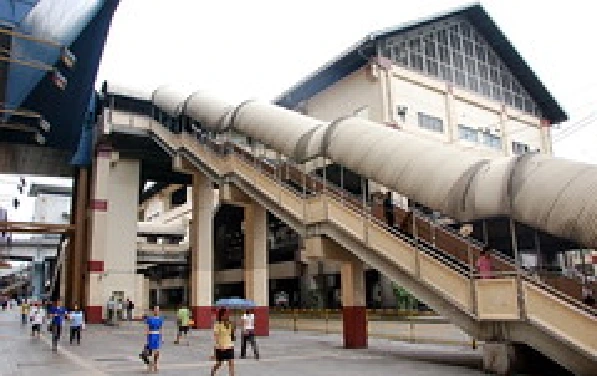
However, the bus is still preferred by some due to its more direct access to both origin and destination in the vicinity of EDSA, as well as the fact that buses are available on a 24-hour basis. The rail transit operates only within a scheduled routine, which is from 5:30 a.m. until 10:30 p.m. daily.
When traversing the city, North-South bound and East-West bound buses are confined along EDSA and Ortigas Avenue, respectively. Visual representations of the different routes are shown in Map 57.
Water Transportation
The presence of the Pasig River stretching along the south border of the city provides an alternative route and mode of transport mainly for cargo freight of industries along the river, and for commuters opting for a faster and more direct route to and from the cities of Pasig and Manila.
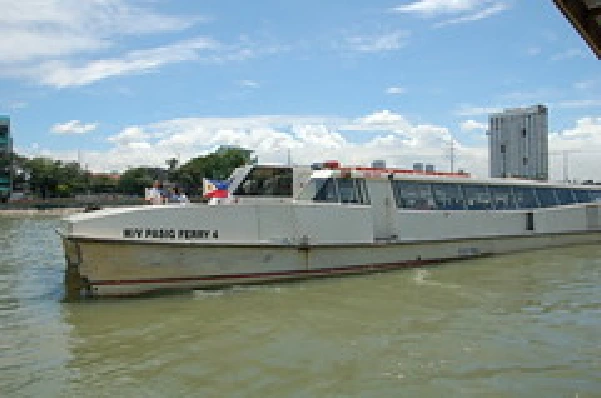
Brgy. Hulo hosts one of 14 stations operated by the Pasig River Ferry Service. In addition, traditional wooden bancas still carry passengers across the river to and from Makati City.
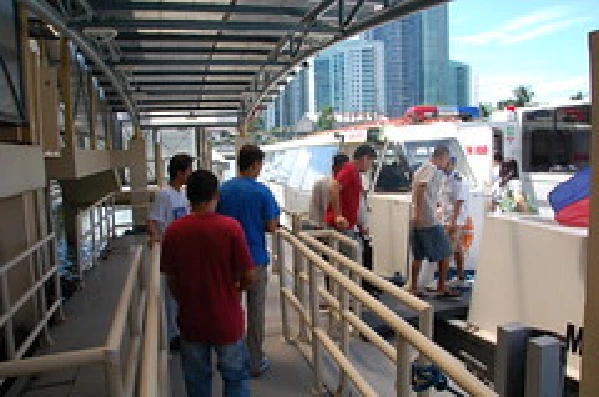
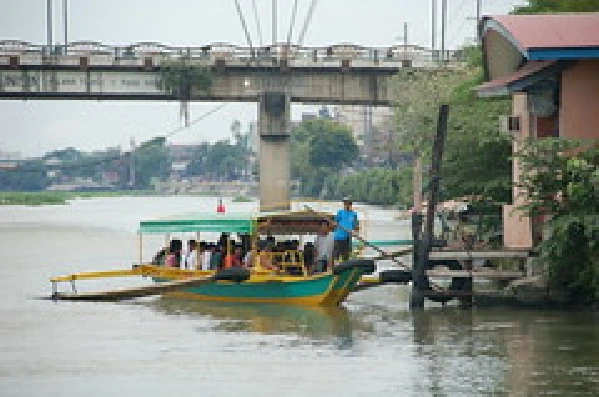
Map 58 shows the locations of water transport terminals and Tawirans in the city.
Issues and Problems
Despite oversupply of roads, the city is not spared from traffic problems prevailing in Metro Manila. Some of the factors contributing to the worsening of traffic situation are identified as follows:
Intensification of Land Uses
The policy to encourage a more efficient use of land by allowing higher density activities has also attracted more clients and consumers who, in turn, require transportation, thus resulting in increased volume of vehicles and busier road network.
Lack of Parking Spaces for Residential Buildings
Highly populated areas in some barangays of the city have also generated problem on insufficient parking. A lot of houses have no provision for parking, thereby utilizing the streets as parking during night time or even longer. Although the city has designated areas of tow-away zones, there is still the issue of not having enough home/private parking for residents.
Illegal Operation of Public Utility Vehicles
As of February 2001, 946 units of Public Utility Jeepneys have franchised operations listed by the LTFRB with more than 50% having expired franchises confirming unofficial reports of PUJ’s illegally operating in the city. These “colorum” jeepneys compete with those legally operating in picking up passengers, ignoring the designated loading/unloading zones resulting to obstruction of traffic flow and exposing passengers/commuters to the hazards of traffic accidents/ reckless driving.
Lack of Transport Support Facilities
Based on the reports of the local Barangay Operation Center – Traffic Division, the most common causes of congestion in the 10 busiest road intersections in the city are the presence of multiple intersection roads and the lack of transport support facilities, as follows:
1.Pedestrian lane
2.Pavement markings
3.Yellow Box
4.Signboards
5.Center Islands in Multi-lane roads
6.Traffic Signal Lights
Lack of Discipline Among Public Utility Drivers
A frequent complaint is the lack of discipline among tricycle drivers plying the Bone Avenue – Producer’s Market and Boni Avenue – Crossing routes as manifested by over-speeding, swerving and sometimes racing with fellow tricycle drivers. In addition, road courtesy is almost absent among these drivers as can be observed in frequently-used road intersections. Furthermore, tricycles occasionally take major transport routes despite clear traffic prohibitions, endangering passengers while at the same time being a nuisance to other motorists.
Jeepney drivers on the other hand, oftentimes behave like their colorum counterparts as earlier described.
WATER SUPPLY
Water Distribution System
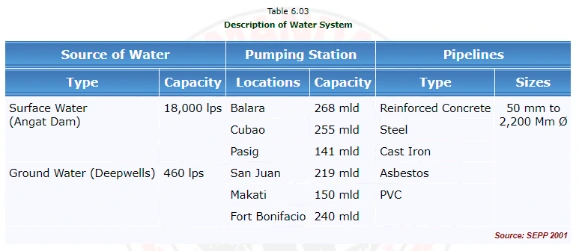
Water supply for the city comes from two sources: Angat Dam, a surface water with a discharge capacity of 18,000 lps and ground water, deep wells having discharge capacity of 460 lps. At present, two PTF deep wells, named after the Presidential Task Force who undertook the installation project, augment the water supply in the vicinities of Brgy. Plainview and Brgy. Barangka Drive.
In addition, around 60 public deep wells supply households lacking connections from the water distribution system, while 18 units of deep wells serve the industrial sector.
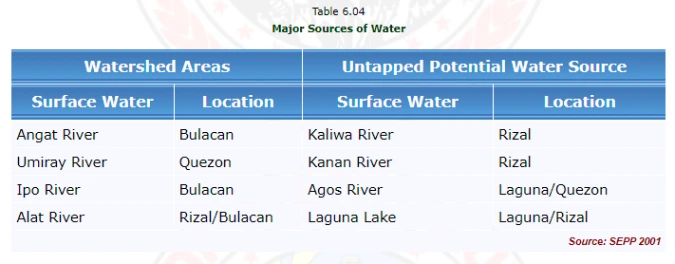
Generally, the city is supplied by the Manila Water Company Inc. (MWCI), a private waterworks system whose network (see Table 6.03) covers eight local government units in the eastern part of Metro Manila, and derives water from major water shed areas in the provinces of Bulacan, Rizal and Quezon (Table 6.04). The network operates six pumping stations with drawing capacity ranging from 141 to 268 million liters per day. Water is then distributed through pipelines of different materials (RC, Steel, Cast Iron, Asbestos and PVC) with diameters ranging from 50mm to 2,200 mm. Main distribution pipes in the city measure about 300 to 500 mm diameters (Map 59).
Status of Water Service
Census 2000 reveals that only 32,645 households or 54.70% of the total number of households in the city have individual water connection from distribution system, while 32.38% still rely on dug wells for water supply. (Table 6.05a & Table 6.05b).
Although the water from the main distribution system is maintained safe for drinking, more and more households are getting cautious so as to use this water mostly for laundry and bathing purposes only. Drinking water is more often bought from water filter and refilling stations and this is evidenced by proliferation of such stations along both major and interior roads in the city.
MWCI, on the other hand, reports that status of water service connection in Mandaluyong is now 98%.
Water Sampling and Monitoring
The Sanitation Division of the City Health Office conducts regular monitoring of water sources on various places such as schools and restaurants, as well as all water refilling stations operating within the city.
POWER SUPPLY
Existing Facilities and Equipment
Power services in the city are provided by the Manila Electric Co. (MERALCO) through six (6) 115 KV sub-transmission systems: the Mandaluyong substation and SM-Shangrila Substation, both located within the city; and the Pandacan, Rockwell, Sta. Ana and Meralco Substations. Electricity is distributed to the users through 34.5 KV Distribution System and 6.24 KV Distribution System (Map 60), the latter serving portions of Brgy. Addition Hills north of Shaw Boulevard and certain areas on the western part of the city.
Status of Electrification
Existing distribution system covers the entire city. As of year 2000 there are a total of 55,442 connections consisting of residential, commercial, industrial and streetlighting facilities, with an average energy consumption of 58,879,700 KWH per month or a total of 529,917,303 KWH for the year (Table 6.06). About 16.22% of the households remain unserved most probably due to their economic status and location in depressed areas, though majority of households in these areas have already benefited from the Depressed Areas Electrification Program (DAEP) of MERALCO.
There is, however, a discrepancy between this data and the NSO Census 2000 report as the latter reveals 93.05% of the households use electricity as source of lighting (Table 6.07). Although illegal connection cannot be disregarded, such discrepancy can be partially justified by the 2000 NSO Census on Population which shows that some households actually dwell within commercial establishments and industrial compound.
Still illegal connections remain a major concern not only in its economic aspect but also in the environmental aspect as probable fire hazards and causes of accidental electrocution.
Ongoing Projects (2001-2005)
In anticipation of increased power requirements (Table 6.08) as a result of the intensification of land uses/activities, MERALCO has two Electric Capital Projects in the pipeline for implementation within the years 2001-2005 period as listed in Table 6.09.
The fourth power transformer at Rockwell substation, although designed to serve mostly the Makati area, will include construction of approximately 1.05 km long 34.5 KV three-phase overhead line along J.P. Rizal and Sheridan Streets. Also included is the reconductoring of approximately 0.30 km of existing 34.5 KV three-phase line along Sheridan Street.
The Pioneer substation, on the other hand, is intended to serve the anticipated bulk power requirement of the Mandaluyong Central Business District having an estimated ultimate load of 486 MVA. Service areas of these projects are also shown in Map 60.
Beyond the 5-year period as mentioned, another 115KV-34.5 KV substation is being proposed. This is to be located within the Welfareville Property, intended to serve the bulk power requirement of the planned development of said property into a high intensity mixed use commercial-residential area.
In addition, modernization of street lighting facilities is proposed to improve visibility of roads at night and at the same time replace existing dilapidated facilities.
DRAINAGE AND SEWERAGE
Natural Drainage
Surface runoffs drain from the rolling slopes and high plains to six creeks: Maytunas, Buhangin, Maysilo, Mayon, Buayang Bato and Ermitanio, and eventually flow to San Juan and Pasig Rivers. (Refer to Map 2 & Map 3 Chapter 1).
Man-made Drainage
Existing Drainage System
To collect surface runoffs and carry it off to receiving water bodies, the city developed a network of Reinforced Concrete Pipes with sizes varying from 24ӯ, 30ӯ and 60ӯ and covered line canals lining all city and barangay roads. This network connects to main drainage facilities lining national roads. Details of the whole drainage network serving the city are reflected in Map 61.
It is important to note that while all circulation roads are served with drainage facilities, the map reflects only those with records updated since 1986. Records of sizes and types of drainage facilities installed prior to 1986 are not available at the moment, and so are those along private subdivision roads which are maintained and operated by the subdivision management.
Installation and Maintenance
All national projects including roads and drainage facilities are implemented and maintained by the Department and Public Works and Highways. Its counterpart at the local level is the City Engineer’s Office which is responsible for all local roads and drainage facilities in Mandaluyong. Both manual labor and mechanical equipment (vactor) are applied to maintain these facilities functioning and free of objectionable matters.
Flood Prone Areas
Flood prone areas in the city are generally those with lower elevation serving as catchment areas to the uplands. These areas are at random parts of the city given its natural topography where some points are even lower than the Pasig River shoreline. Flash floods in Maysilo Circle for instance, where the city hall is located, have become a common sight during rainy seasons. Based on the Slope Map (See Map 2), a spot height at Maysilo Circle fronting San Francisco Street is 2.0 meters while spot heights along Pasig River are at 3.0 meters. There are, however, certain areas in higher elevations identified as flood prone which point to the fact that other factors may have caused flooding. (Refer to Vulnerability to Geohazards).
Causes of flooding
Clogged Drainage Facilities
While the city may be adequately served with drainage facilities considering the lengths and sizes involved, flooded areas and heavy traffic in rainy days point to its inefficiency. For one, rubbish unconscionably discarded on streets and other public places eventually find its way to manholes and drainage pipes and canals, thereby clogging the system. Worse, there are instances wherein worn-out household appliances and dead animals are found in the system during de-clogging operations.
Overflowing of Creeks and Rivers
Pasig River serves as the main outlet of Laguna Lake, Marikina and San Juan Rivers, and other small tributaries. Siltation, sunken derelicts, and other matters thrown into the river considerably lessen its carrying capacity causing it to overflow especially on heavy rains and stormy weather. The same goes with creeks which serve as sewer and garbage dumps to those illegally occupying its shoreline.
WASTE MANAGEMENT
Solid Waste Generation
Mandaluyong City generates about 1,200 cu. meters to 240 metric ton of solid waste a day, a combination of domestic, commercial/industrial, and institutional/ hospital waste (Table 6.10). As of year 2000, the total volume of waste generated amounted to approximately 396,780 cu. meters with an average of 33,065 cu. meters a month. The volume generated for the month of January is usually the highest (Table 6.11) as more wastes are produced during Christmas holidays and New Year Festivities.
In addition, each individual generates approximately 0.71 kg of solid waste per day, which is beyond the standard range of 0.23 to 0.60 kg or an average of 0.40 kg per capita per day as indicated in several studies in Metro Manila. One contributing factor to such increase is the intensive use of disposable materials in lieu of reusable day to day items such as food containers, kitchen utensils, personal paraphernalia and the like, as can easily be observed from filled garbage bins and street litter.
Collection and Disposal System
Waste collection and disposal system is being undertaken by the City Environmental Cleaning and Beautification Department, formerly known as Environmental Sanitation Center. The department is manned by 14 administrative staff, 199 street sweepers, and 45 individuals doing general maintenance works, which total to 258 individuals who unfortunately are not sufficiently trained on discharging solid waste management services.
At the time when San Mateo landfill is still operational, truck collection procedures (Map 62) are a combination of daily mopping of main roads and market areas, night operation covering five barangays, and Blocking System — a twice-a-week operation for the rest of the City. The closure of the San Mateo Landfill in December 31, 2000 had tremendous impact on the collection system which was immediately felt by the city at the start of year 2001.
Actual collection and transport to the disposal site are undertaken by LGU-hired private contractors utilizing 40 dumptrucks, each with an average capacity of 18 cu.m. per truck load. For the year 2003, it is reported that garbage collection along major thoroughfares, as well as market places are done daily, and that other residential areas are visited only twice a week for their trash.
Waste Management Practices
Segregation and Composting
Pursuant to Republic Act 9003 also known as Ecological Solid Waste Management Act of 2000, the City Solid Waste Management Board was organized whose immediate task is to formulate a Solid Waste Management Plan for the city.
Meanwhile, with the worsening problem in waste disposal, the city government has called upon its constituents to practice waste segregation and recycling. To serve as role model, all city hall offices are required to strictly implement waste segregation, with segregation bins positioned in places visible to the public.
In support of this scheme, the Truck Collection System is being modified, with separate schedules for collecting biodegradable and non-biodegradable wastes.
At present, about 15% of the total waste collected is segregated.
Composting
With the objective of further minimizing waste for transport to its final disposal site, a 290 sq.m. lot within the Welfareville Compound is being planned as the site for the City Composting Center.
Barangay Initiatives
With the sincere intention to help save the environment through waste management, two barangays immediately took the initiatives of implementing their own waste management schemes that later on earned them various recognitions at both local and national levels.
Barangka Itaas
Barangay Barangka Itaas has utilized a portion of its public land for its composting operations. Just one year in operation, this barangay has achieved a 50% to 80% reduction in wastes resulting to reduction in number of garbage truck loads from the usual 2-3 truck loads to ½ to 1 truck load per day. Produce from the soil composting project is being used in the Barangay Green House in growing vegetables and ornamental plants for community consumption and beautification purposes.
Barangay Vergara
Taking advantage of garbage trucks pooling in one vacant lot in the barangay, disposal of community waste have been efficiently managed which earned the barangay the Cleanest Barangay Award given by the Metro Manila Development Authority.
Community waste are collected by local manpower roaming around with push carts each morning, later dumping the wastes into a designated area within the motorpool. By arrangement with the contractor, wastes are then carried off by the garbage trucks to the sanitary landfill.
COMMUNICATION
Being at the heart of the Greater Metro Manila, Mandaluyong enjoys access to a complete array of national newspapers, tabloids and magazines of metro-wide, national and international circulations everyday.
Publication
The city produces its own yearly publication which chronicles the events, achievements, programs, and projects of the city mayor and the city council.
To maintain good governance, the city issues occasional newsletter to encourage people’s participation and involvement in resolving public issues, problems and other development needs.
Cable TV/TV
Mandaluyong is serviced by various cable television networks which include Destiny, Sky Cable, Home Cable and Sun Cable.
Radio
Two AM radio stations are actually based in the city, but city radio lovers enjoy a variety of choices for FM and AM stations based in the neighboring cities and municipalities. The two broadcast media networks are 94.7 DWLL on FM and 1098 KHZ DWAD on AM frequencies.
Postal Service
Computerized postal services are discharged by the Mandaluyong Central Post Office housed on a modern structure located within the City Hall compound. The service counters utilize the Postage Automatic Counter Services (PACS) Computers designed to expedite accurate mailing procedures. At present, seventy three (73) postal employees are serving the entire city. To facilitate delivery of incoming mails, service areas are clustered into around forty five (45) delivery beats, each manned by a letter carrier.
Mobile and Land-based Telephone Service
As we are in this technological age of fast-pace communication and ditigal images, there are also a variety of mobile and land-based telephone networks servicing the Mandaluyong area. For mobile telephone service, two major players are Smart Communications and Globe Telecoms. However, there are also a number of new players in the cellular industry like the Touch Mobile and Sun Cellular who enjoy citywide patronage.
For land-based communications, the following are the service providers:
-Globelines
-Digitel
-Islacom
-Bayantel
Telegraph and Courier Services
With the presence of the electronic communication, telegram services have declined over the years. However, there are still a few who provide telegram services like the RCPI. Courier service companies provide an easy alternative to fast communication with their one-day delivery services, be it money transfers, plain written communications, and packages.
Electronic Communication
E-mails, Chat Rooms and Internet downloading have become so much a part of way of life for the modern city life. It is now the best way of connecting to anyone anywhere around the globe which guarantees almost instant response and interaction. The city for the year 2003 has recorded about 17 of these internet shops and stores randomly distributed in the city which provide e-mail, chat rooms and internet access to its customers.